If you have ever run a page through PageSpeed Insights, seen a green score, then opened CrUX Vis and found a different story (or no data at all), you are not doing anything wrong. The two tools measure different things, and knowing which one to trust is the whole game.
So here is the plain-English split between CrUX Vis and PageSpeed Insights: what each one actually measures, why a brand new site sees no field data, and which Core Web Vitals numbers I would act on.
Key Takeaways
- PageSpeed Insights runs a live lab test and shows field data when it exists; CrUX Vis shows field data only, as a weekly trend.
- Lab data is one simulated test for diagnosis; field data is what real Chrome users actually experienced over the last 28 days.
- Google’s Core Web Vitals pass or fail is based on field data, not on your lab score.
- New and low-traffic pages get no field data, because CrUX needs enough Chrome traffic over 28 days, so a green lab score can hide an unknown.
- Trust the field data for the verdict, and use the lab test to find and fix what is slow.
What PageSpeed Insights and CrUX Vis each measure
PageSpeed Insights (PSI) is a per-URL tool. Every time you run it, it fires a fresh Lighthouse lab test in a controlled environment and prints a 0 to 100 performance score. When Google also has real-user data for that page or origin, PSI shows it at the top under “Discover what your real users are experiencing”.
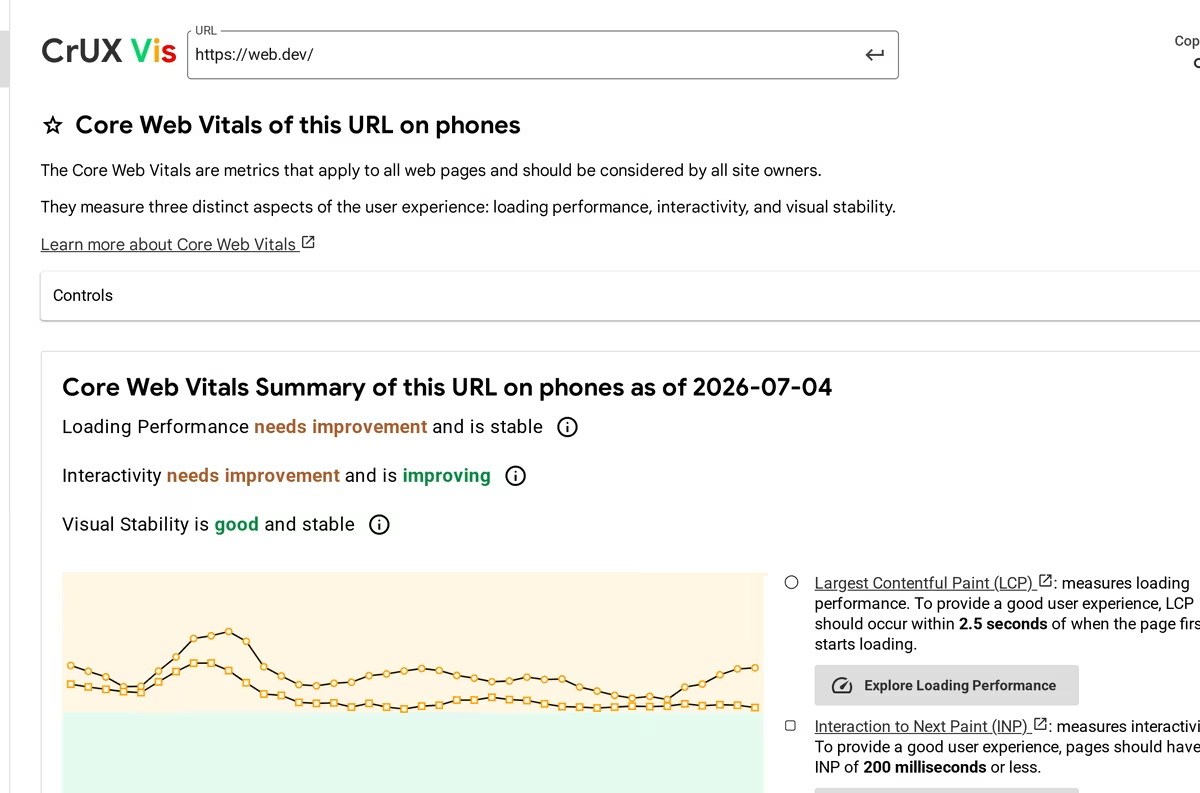
CrUX Vis is narrower and deeper. It is a visual explorer for the Chrome UX Report, the dataset of real Chrome users, and it plots your Core Web Vitals as a weekly trend going back about 40 weeks. There is no lab test here, only what real people actually got.
| PageSpeed Insights | CrUX Vis | |
|---|---|---|
| What it shows | A live lab test, plus field data when it exists | Field data only, as a weekly trend |
| Freshness | Lab runs on demand; field is a 28-day rolling average | Updated weekly on Mondays, about 40 weeks of history |
| Coverage | Any URL, since the lab test always runs | Only pages or origins with enough Chrome traffic |
| Best for | Diagnosing what to fix on one page | Watching real-world trends and confirming a fix |
Lab data vs field data, the split that trips people up
This is the distinction that everything else hangs on. Lab data is a single test run on one simulated device and network, in a controlled lab. It is repeatable and great for debugging, because you can change one thing and re-run it, but it is not what your visitors experienced.
Field data is the opposite. It is collected from real Chrome users over a rolling 28-day window, so it captures real devices, real networks, and real conditions. PSI blends both when it can; CrUX Vis is pure field data. When the two disagree, the field data is the one describing reality.
Why new and low-traffic sites see no field data in CrUX
Here is the part that confuses a lot of store owners. CrUX only reports a page or origin once it has enough real Chrome visitors over that 28-day window. Below that threshold there is simply not enough data to report, so you get a blank where the field numbers should be.
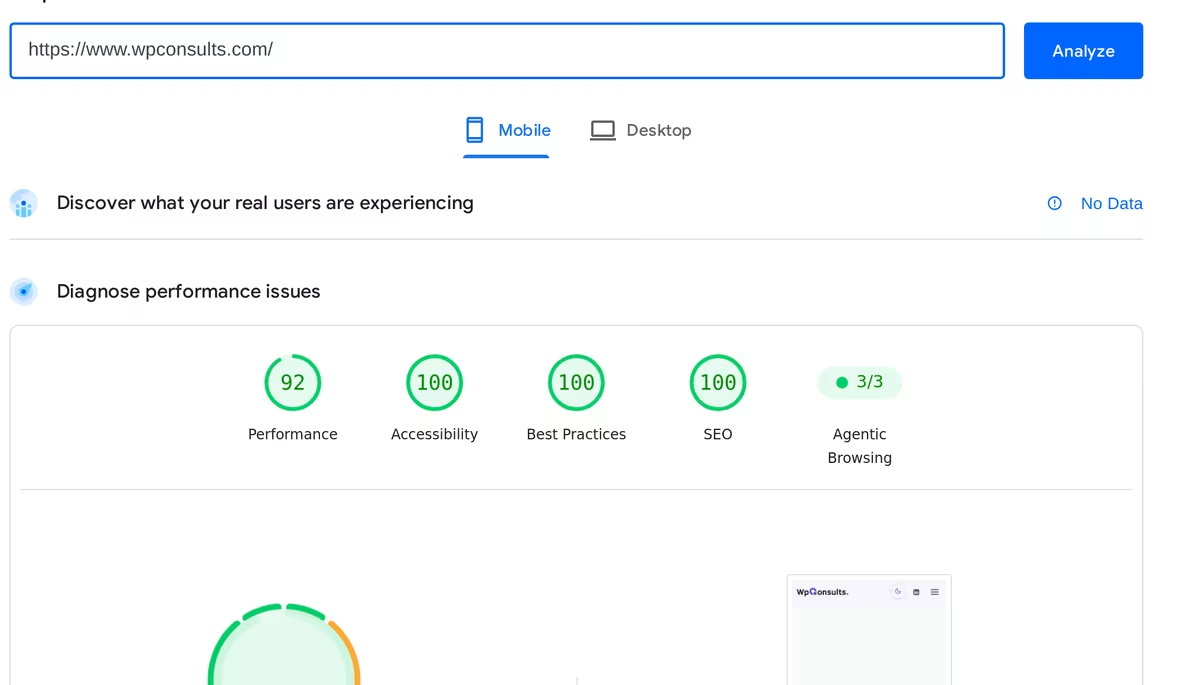
I ran wpconsults.com through PSI while writing this, and it shows the trap perfectly: a green lab Performance score of 92, and right above it, “No Data” for real users. A quiet page can look like it is passing on the lab test while Google holds no field verdict on it at all.
One caveat worth knowing: CrUX works at both the page level and the origin (whole-site) level. A single quiet page might have no data of its own while the origin still does, so always check both before you conclude there is nothing there.
How to read PageSpeed Insights and CrUX Vis together
Once the difference clicks, the workflow is simple. Start in PSI to see whether field data even exists. If it does, that is your real-world verdict on whether the page passes Core Web Vitals. If it does not, fall back to the lab score to diagnose, and get real-user monitoring in place so you are not guessing.
How to read your Core Web Vitals across the two tools
- Run the page in PageSpeed Insights
- Field data shown? That is your real-world pass or fail
- No field data? Use the lab score to diagnose, and add real-user monitoring
- Track the trend in CrUX Vis as traffic builds
Then use CrUX Vis for the long view. Because it plots the last 40 weeks, it is the tool that tells you whether a fix actually landed in the field, or whether a metric is quietly drifting the wrong way over months.
When to use PageSpeed Insights, and when to use CrUX Vis
PageSpeed Insights is what I open first on any single page, especially before a launch or right after a change, because the lab test always runs and points straight at what to fix. From there, a guide on how to pass Core Web Vitals takes over. It is the wrong tool for judging real-world pass or fail from the lab number alone, since that score is an estimate, not what users lived.
Best for PSI: a fast, per-page diagnosis and a fix list on any URL, even one with no field data yet.
CrUX Vis earns its place once a page has traffic. It is the cleanest way to see whether your Core Web Vitals are trending up or down across weeks, which a one-off lab score can never tell you. Often the thing dragging the trend down is the build itself, which is why I dug into whether your WordPress theme is hurting your SEO.
Not recommended: leaning on CrUX Vis for a brand new, low-traffic page; there is nothing to plot yet.
So, which Core Web Vitals numbers should you trust?
Honestly, for the verdict I trust the field data, because that is the data Google’s page experience signal actually uses. Your lab score is the workshop where you diagnose and fix; it is not the scoreboard. A green 92 in the lab is encouraging, but it does not mean real users are passing.
And if you have no field data yet, do not read that green score as a win. Treat it as unknown in the real world, get real-user monitoring running, and keep an eye on CrUX Vis as your traffic grows. That way, the day Google does have a field verdict on you, it is not a nasty surprise.
Getting mixed signals from your Core Web Vitals?
If your lab score and your field data are telling you different stories, contact us or email me and I will help you work out which number to act on. Reading the data right is half the fix.
Update Logs
6 Jul 2026
- First published: a plain-English breakdown of CrUX Vis versus PageSpeed Insights, lab and field data, and why low-traffic pages show no field data.
Want our posts to show up more often on Google?
One step & Google will surface this site in your Top Stories.