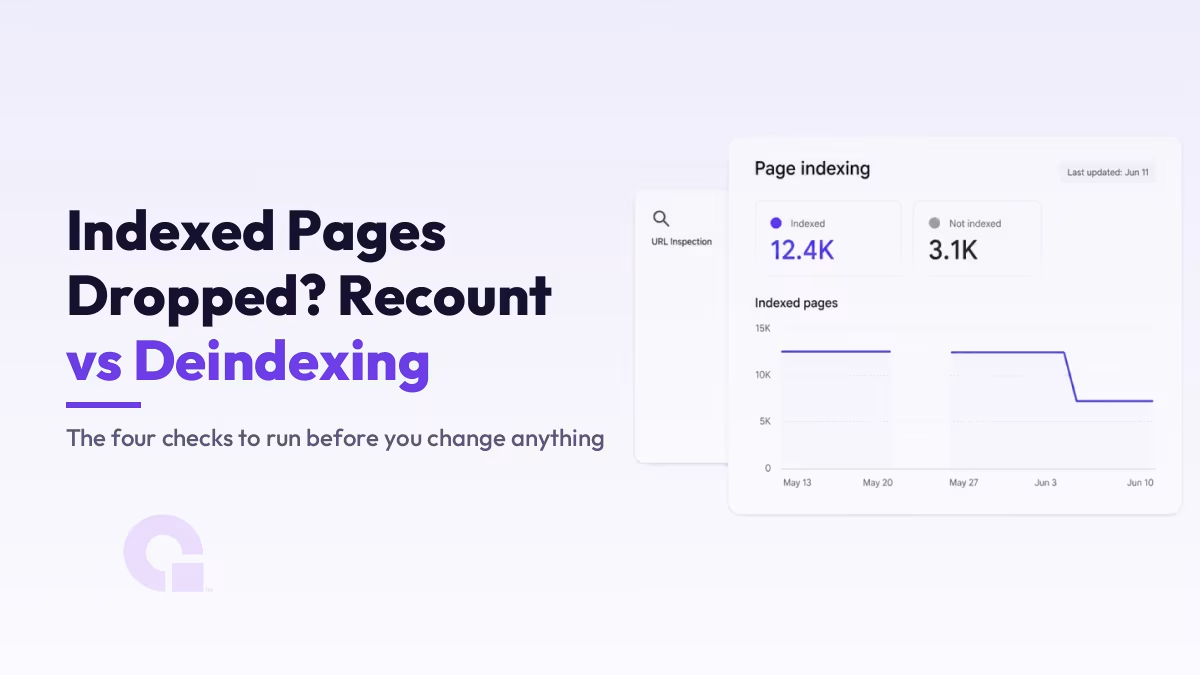
The Search Console page indexing report froze on June 11, 2026, sat still for almost three weeks, then came back with a step down that made plenty of sites look like they had lost pages overnight. Most of those cliffs were bookkeeping catching up, not deindexing.
In this piece I will walk you through why a frozen report ends in a cliff, and the four checks I run to confirm whether pages actually left Google’s index before touching anything.
Key Takeaways
- The page indexing report is a delayed snapshot of Google’s bookkeeping, not a live feed of the index; the two can drift weeks apart.
- When the report freezes, indexing keeps moving in the background, so the catch-up lands as one step on the graph instead of a gradual slope.
- A recount cliff leaves the Performance report stable; real deindexing pulls impressions down with it.
- URL Inspection and your server logs are the ground truth for individual pages, not the trend line.
- The worst response to a stale report is bulk resubmitting sitemaps and re-requesting indexing; check the report’s own last-updated date first, then judge.
- The widely repeated line that this “only affects reporting” is a real Google statement from December 2025, about an earlier stall; Google has said nothing on the record about the 2026 delay.
What happened to the page indexing report in June 2026
The report’s data stopped updating on June 11 and stayed frozen while indexing itself kept running normally, as Search Engine Land reported.
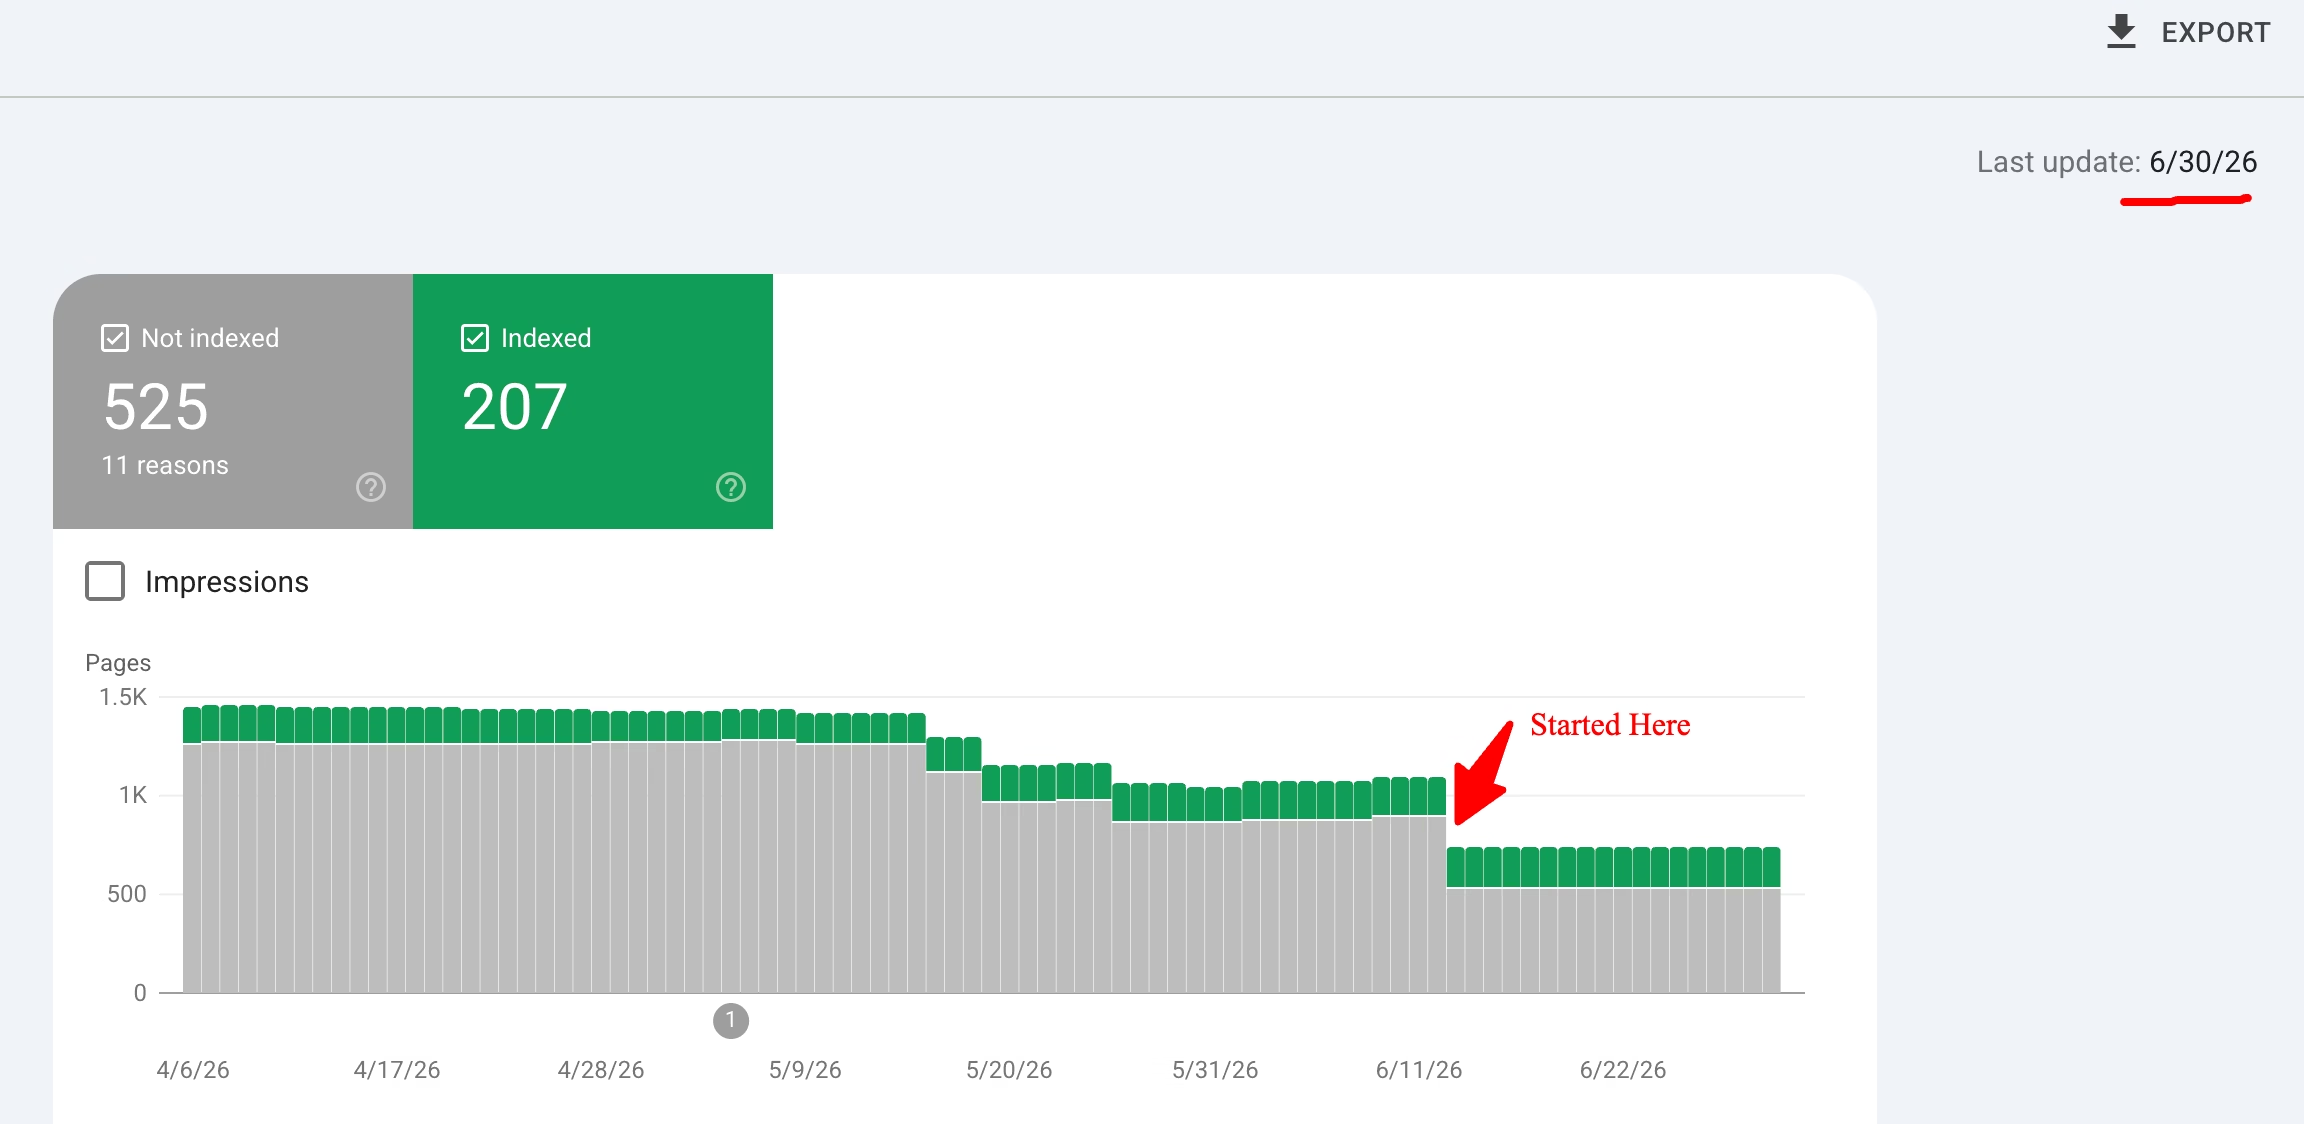
Almost three weeks in, John Mueller John MuellerSearch Advocate, GoogleGoogle's Search Advocate and the main on-the-record voice of Google Search Relations.LinkedInXSearch Central said the team was working on it with no ETA. When the report finally caught up, it jumped straight to June 29 data, and Barry Schwartz’s coverage noted the odd step down many properties saw once the numbers repopulated.
This is not a one-off either. The same report ran a month-long delay in early 2024, so treating freezes as a recurring behavior of the tool, rather than an emergency, is the realistic posture.
Now the line everyone repeats about this, which is that the delay only affects reporting. I want to be straight about where it comes from, because the first version of this post was not careful enough with it. It is a real Google statement, but it was made about an earlier stall, not this one.
Google Search Central posted it on LinkedIn in late 2025, in a message Search Engine Journal reported on 1 December 2025: “We’re currently experiencing longer than usual delays in the Search Console Index Coverage report. This only affects reporting, not crawling, indexing, or ranking of websites. We’ll update here once this issue is resolved.”
That was a different incident seven months earlier, and the screenshot alongside it showed data last updated 18 November 2025. Google also still called it the Index Coverage report there, the older name, which is a decent clue to the quote’s age on its own.
I have found no Google statement about the June to July 2026 delay at all. So the reassurance is probably still true, because the mechanism has not changed, and the four checks below are how you confirm it on your own site instead of taking it on trust.
The timing did not help either. The June 2026 spam update was rolling out while the report sat frozen, so plenty of people read one graph and blamed the other, and keeping those two apart is most of the work here.
What does the page indexing report look like now, after the second stall?
It delivers a handful of wide multi-day snapshots instead of a daily line. The report is updating again, but each bar can now cover a stretch of days rather than one, so the graph has fewer points and much longer gaps between them.
Brodie Clark measured the grouping and found three windows: 11 to 24 July, 1 to 10 July, and 13 to 30 June, as Search Engine Roundtable reported. Those are his numbers, not mine, and they will have moved on by the time you read this; the shape is the durable part.
That shape creates a problem the freeze did not. When fourteen days collapse into one snapshot, a change you shipped on day three and a change you shipped on day twelve land in the same bar.
You cannot tell which one moved the number, and the step between two snapshots reads as a sudden change that never happened that way. It happened gradually, across days the report is no longer showing you.
The fix is procedural rather than technical, so it costs you nothing but discipline:
- Write down the date of every indexing change you make. Your own log becomes the timeline the report is no longer giving you, and it is the only way to line a change up against the right snapshot later.
- Keep one indexing change per snapshot window. If you noindex a template and prune thin pages in the same fortnight, the report will show you one number and you will never learn which decision earned it.
- Read the trend across snapshots, not the edge between two. A single step from one wide bar to the next is the weakest evidence on the chart right now, because most of what created it is hidden inside the bar.
Why is Google Search Console not updating your data?
Usually because the specific report you are looking at is lagging or grouped, not because Search Console as a whole has stopped. Each report runs on its own pipeline and its own delay, so the page indexing report can sit frozen for weeks while the Performance report keeps updating daily.
That is worth knowing before you go looking for a fault on your side, because those two reports disagreeing is normal rather than a symptom. It is also why the checks further down compare them against each other instead of trusting either one alone.
Which report is stale also changes what you should do. A lagging Performance report misleads you about traffic, a lagging page indexing report misleads you about coverage, and a property-level mismatch can just mean you are reading a different property than you think.
Worth separating one thing from all of this: if a URL sits in a state like Crawled, currently not indexed, that is a coverage verdict Google has actually reached, not a reporting delay, and it needs a different response.
One thing I will not give you is a normal refresh cadence in days, because no Google document states one. The numbers circulating on this subject are community guesses that got repeated until they sounded official, and the report’s own last-updated date is the only figure worth trusting.
Has Google logged the page indexing report delay anywhere?
No. As of 30 July 2026, Google’s Data anomalies page for Search Console lists nothing under Page indexing Report; it reads “No recent issues”, even though the stall has been running since June and has been covered by Search Engine Land, Search Engine Roundtable and Search Engine Journal.
That page describes itself as recording “known issues in the last 3-16 months that might affect your data”, so it is the designated place for exactly this kind of note.
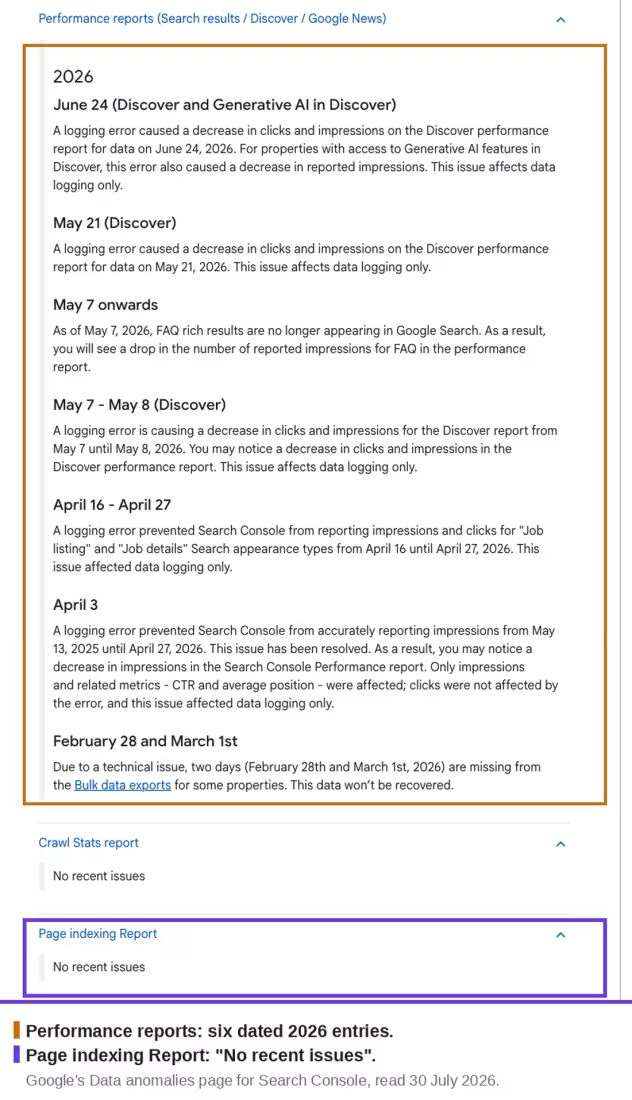
The obvious reply is that nobody maintains that page, and the screenshot closes it. The Performance reports section carries six dated 2026 entries, one of them for a single day, 24 June 2026, and another for a two-day gap in the bulk data exports back in February.
So somebody is keeping that page current at day-level detail. Be careful how much weight you put on the gap, though, because an absence from a log is a fact about the log, not a denial, and Google may simply not classify a delayed refresh as a data anomaly worth listing.
What it does mean practically is that you should stop waiting for an official notice to tell you the report is stale. Check the report’s own last-updated date, which is the first of the four checks below, because that is the only status page you are going to get.
Why a frozen indexing report ends in a cliff, not a slope
Google’s own documentation for the report is upfront that it reflects the index with a delay of a few days even in normal weeks. It is a periodically refreshed snapshot of Google’s bookkeeping, not a live counter, and that distinction is the whole story here.
During a freeze, pages keep getting indexed and dropped in the background at their usual pace. When the reporting pipeline comes back, all of that accumulated movement lands in a single refresh, so a change that really happened gradually across three weeks renders as one vertical step on the chart.
How a report freeze turns into a cliff on the graph
- The page indexing report stops refreshing (June 11)
- Indexing keeps moving normally in the background
- Google repairs the reporting pipeline weeks later
- Three weeks of gradual change land in one refresh
- The graph draws a cliff that never happened as a cliff
The same mechanic works in the other direction, by the way. Some sites came back from the freeze with a step up in indexed pages, and that jump was no more a sudden win than the drop was a sudden loss.
How to check whether pages actually left Google’s index
Four checks, in the order I run them on a client property. Together they take under an hour, and they settle the recount-or-real question with actual evidence instead of a trend line.
1. Check the indexing report’s own last-updated date first
The report prints its freshness right at the top, and that stamp is the first thing to read, not the graph. If the date is weeks old, every conclusion drawn from the chart is a conclusion about stale bookkeeping. During the June freeze that stamp sat at June 11 the whole time, which told you everything the graph could not.
2. Read impressions in the Performance report against the drop
This is the strongest single signal, because Performance data runs on a separate, much fresher pipeline. A page that genuinely leaves the index stops earning impressions, so real deindexing at scale shows up as an impressions decline that tracks the drop.
If your indexed count fell off a cliff while impressions stayed flat through the same window, the pages are still serving in search and the cliff is a recount. That mismatch settles most cases on its own.
3. Inspect a sample of the dropped URLs with URL Inspection
Export the not-indexed list from the report, pick 10 to 20 URLs that matter commercially, and run each through URL Inspection. The live verdict there is per-URL ground truth, and it is fresher than the aggregate report that alarmed you.
Pay attention to which bucket the report claims they fell into. “Crawled, currently not indexed” on thin or duplicate pages is Google pruning what it never valued, which is a content decision, not a technical emergency.
4. Confirm Googlebot is still crawling in your server logs
Your access logs are the one record Google’s reporting delays cannot touch. If Googlebot kept hitting the supposedly dropped sections at its normal rate through the freeze, the index story and the crawl story disagree, and the logs win. I walk through the full method in my log file analysis guide, and the same pull doubles as a crawl budget health check while you are in there.
| Signal | Points to a recount | Points to real deindexing |
|---|---|---|
| Report last-updated date | Weeks old, or just refreshed after a gap | Current, updating on its normal cadence |
| Impressions (Performance report) | Flat through the drop window | Declining in step with the indexed count |
| URL Inspection on sampled pages | Sampled URLs still show as indexed | Live tests confirm pages are out |
| Server logs | Googlebot crawling at its usual rate | Crawl rate collapsed on the affected sections |
What not to do while the indexing report is stale
The reflex moves are the damaging ones. Bulk resubmitting sitemaps does nothing to refresh a frozen report, and hammering Request Indexing across hundreds of URLs burns your quota on pages that were never actually out. Neither action speeds Google up; both just add noise to the picture you are trying to read.
The more expensive mistake is shipping site changes to “fix” a problem the data has not confirmed: noindex audits, redirect sweeps, content culls. It is the same panic misread I covered with fake ranking drops: reacting to a measurement artifact creates the real damage the artifact only implied. Run the four checks, and if they all point to a recount, the correct action is none.
So, did Google deindex your pages or just recount them?
If this were my property, I would bet on the recount and then verify, because after every freeze the base rate leans heavily that way. A frozen stamp, flat impressions, indexed samples, and a normal crawl rate close the case in an hour, and most sites that ran those checks in July found exactly that.
The honest caveat: sometimes the drop is real, and the freeze just delayed the news. If impressions fell in step with the count and your sampled URLs test as out, you have a genuine indexing problem to diagnose, and the earlier sections of the report (which buckets grew) tell you where to start digging.
Still not sure what your indexing report is telling you?
Don’t hesitate to contact us or email me and I will help you read the drop properly before you change anything. Remember, a calm hour of verification is cheaper than a month of undoing panic fixes.
Update Logs
30 Jul 2026
- Corrected the claim that Google confirmed this delay was only a reporting problem. That statement is real, but it was made in December 2025 about an earlier stall, and it is now quoted, dated and attributed properly; no Google statement about the June to July 2026 delay appears to exist.
- Added what the report looks like after the second stall (wide multi-day snapshots instead of daily data), the attribution problem that grouping creates, and how to keep your own change log readable through it.
- Added a first-hand check of Google’s Data anomalies page, which still shows nothing under Page indexing Report while logging six separate 2026 Performance-report issues.
06 Jul 2026
- Published with the full June 2026 freeze timeline (stuck at June 11, caught up to June 29 data) and the four verification checks for separating a recount from real deindexing.
Want our posts to show up more often on Google?
One step & Google will surface this site in your Top Stories.