Query Competitiveness and Citation Source Composition in Google’s AI Overviews: Evidence From a Repeated-Measures Ecommerce Query Ladder
- Published
- Version 1.1
- Type Preprint
- Review Not peer reviewed
- License CC BY 4.0
Reviewed in-house before publication
Abstract
Practitioner guidance holds that small operators should abandon competitive head terms for the long tail, assuming the AI Overview citation pool opens up as a query becomes less competitive. We tested it on a designed sample: a 21-query ecommerce ladder banded HEAD, MID, and TAIL, containing three matched head-to-tail pairs, captured in four English-language markets across six rounds, signed out, with the sources panel scrolled to exhaustion. One query in one market in one round is a cell; the analyzable sample was 503 usable cells of 504 designed.
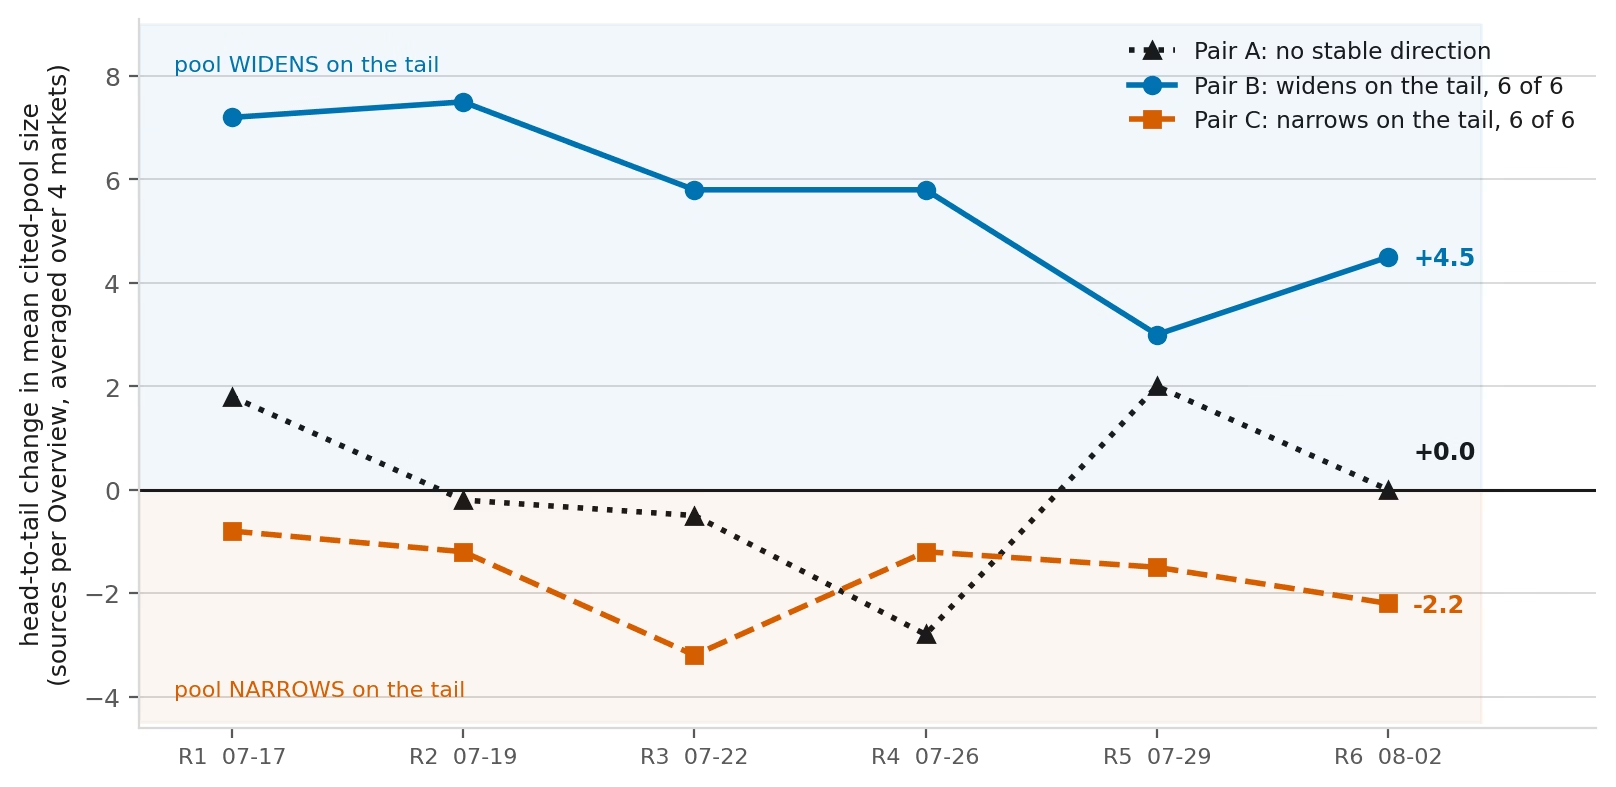
No Overview-free result page was found among them, every apparent absence resolving to a blocked or faulty instrument, falsifying the pre-declared null that the feature would not fire on long-tail or frontier ecommerce queries. Cited-pool size did not track competitiveness: of three matched pairs, one widened on the tail in all six rounds, one narrowed in all six, one closed at zero, so the pre-declared no-gradient null is published as a result.
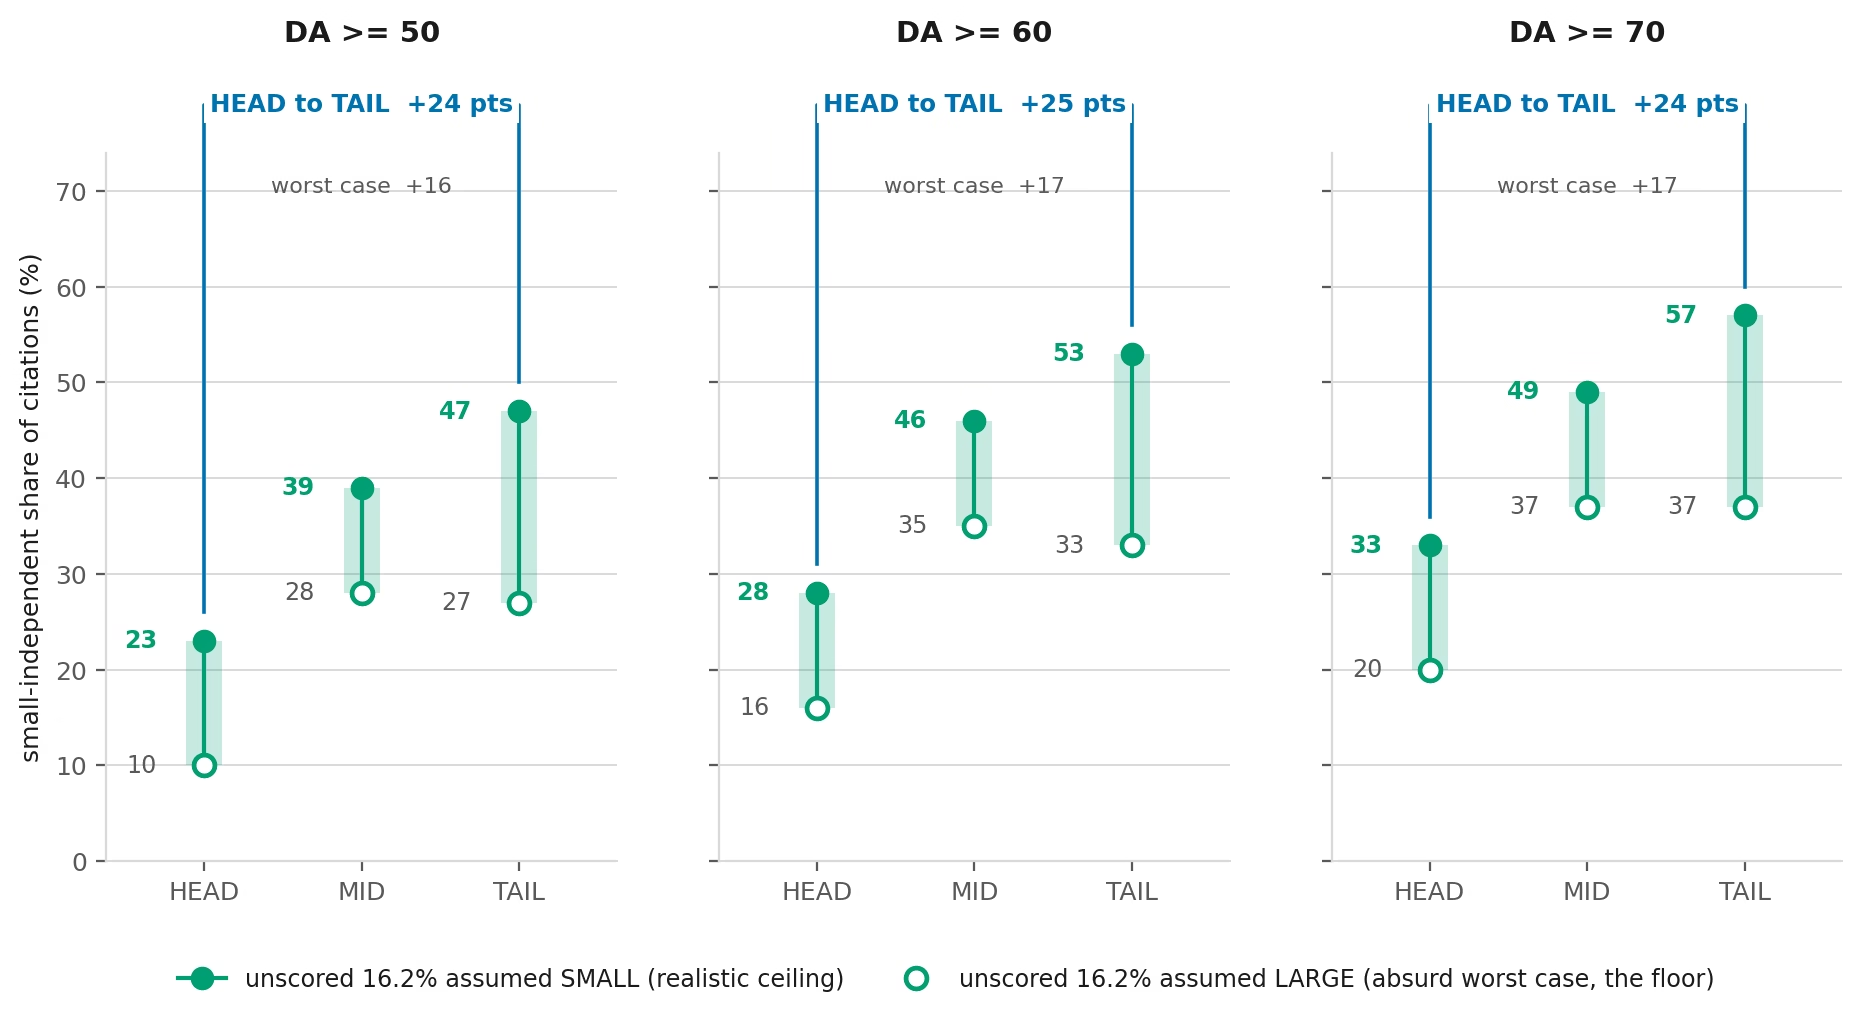
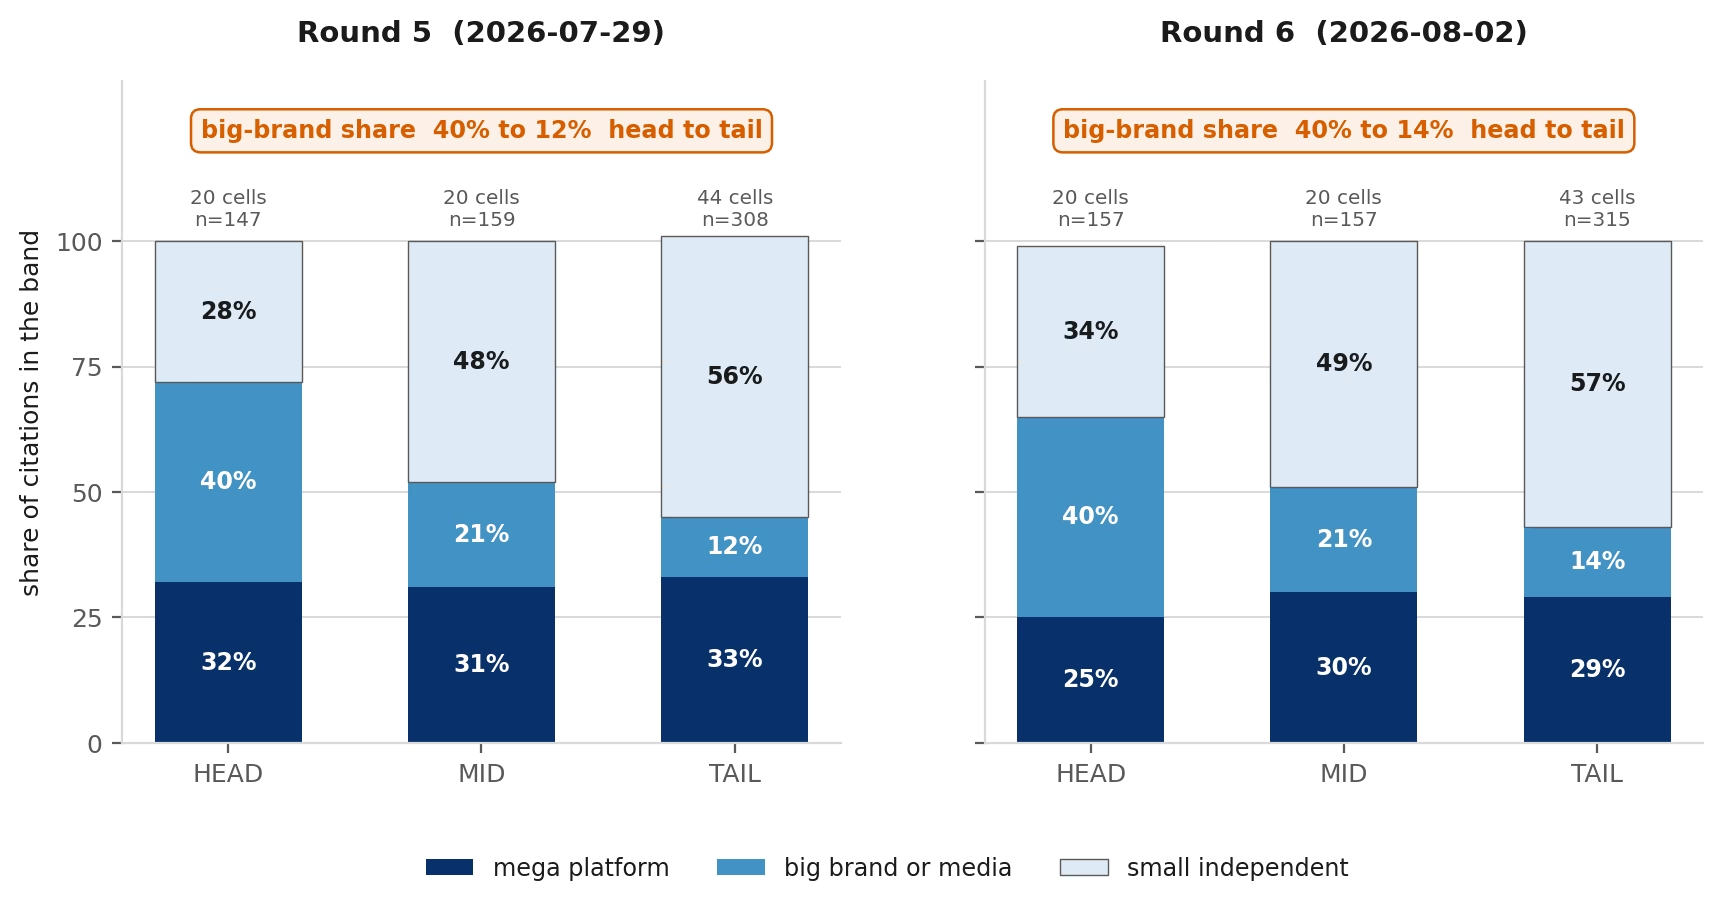
Citation source composition did move. Scoring 200 of 667 cited domains for domain authority (83.8% of citations) and bracketing the unscored remainder at both extremes, small-site citation share rose from head to tail by 16 to 25 points at every threshold tested. Decomposition under a separate curated classifier, in two rounds, showed mega-platform share approximately flat while big-brand share fell from 40% of head citations to 12 to 14% on the tail. The defensible conclusion is that big brands stop competing on the tail, not that small sites win more.
Keywords AI Overviews, generative engine optimization, generative search, citation analysis, retrieval, extractability, corroboration, search engine optimization, ecommerce, long tail, repeated measures
What we found
The advice I set out to test is one you have probably heard: stop fighting for competitive head terms and go long tail, because the AI Overview citation pool opens up down there. It is plausible, and as far as I can establish, nobody had tested it on a sample built to answer it.
So I built one. A 21-query ecommerce ladder banded head, mid and tail, with three matched head-to-tail pairs inside it, captured in four English-language markets across six rounds, signed out, with the sources panel opened and scrolled to its end every time. One query in one market in one round is a cell, and 503 of the 504 designed cells came back usable.
The Overview fires everywhere, including where I expected it not to
I declared before the first capture that the feature would thin out on near-zero-volume and frontier ecommerce queries. It did not thin out at all. Across the 504 designed cells there was not one Overview-free result page, and every apparent absence resolved to a blocked or faulty instrument rather than a missing feature.
That null is falsified, and it is published as falsified because I said in advance I would publish it either way. For a publisher in this vertical, the practical reading is that there is no query specific enough to sit below the feature, so the question is where to engage with it rather than whether to.
Who gets cited changes, but how many get cited does not
Composition moved, and it moved a lot. I scored 200 of the 667 cited domains for domain authority, which covers 83.8% of citations, then bracketed the unscored remainder at both extremes so you can see the bounds instead of one tidy number. Small-site share of citations rises from head to tail by 16 to 25 points at every threshold I tested.
Pool size is a different story. Of the three matched pairs, one widened on the tail in all six rounds, one narrowed in all six, and one closed at exactly zero.
That is three pairs producing three individually stable behaviors that contradict each other, so the no-gradient null I declared before capture gets published as a result. A study that had run any one of those pairs would have published a confident and wrong finding in whichever direction its pair happened to point.
The mechanism is vacancy, not favor
This is the part I would most want a practitioner to take away. Under a separate curated classifier, in the two rounds where the full three-bucket split was recorded, mega-platform share stayed roughly flat across bands while big-brand share fell from 40% of head citations to 12 to 14% on the tail.
So the tail is not a door the system opens for smaller sites. It is a space the big brands were never going to write the specific page for, and they left it. Big brands stop competing on the tail; small sites do not win more of a contested space, and advice built on “the algorithm favors small sites down there” rests on a mechanism this data does not show.
Worth adding that the pool was not closed at the head either. The top five platforms never took more than a third of citation instances in any round, and each round carried between 200 and 332 distinct cited hosts across 503 cells, so retreating to the tail to escape a closed door is retreating from a door that was not shut.
The part that cuts against my own result
I changed the size classifier three times before freezing it, and the head number moved by more than 20 points on where about 24 domains landed. That is why this paper publishes a table of bounds rather than a single figure.
It is also why I would read any single-classifier size claim in this field, including one built on a much larger sample than mine, as a classification decision until somebody shows it survives a sensitivity analysis.
Figures
Limitations
- Six rounds, not the designed eight. The study closed after six on 2026-08-02, which bears most on the churn measure, where there are only five round-to-round reads.
- One cell of 504 is missing. The sources panel refused to open on two reads, and the stored screenshot shows a full signed-out result page with the Overview fired, so it is an instrument fault rather than an absent Overview.
- 16.2% of citations are unscored for domain authority. Those 467 domains are handled by a two-way bound rather than by an assumption, and the bound is wide, which is why no smooth three-step gradient is claimed anywhere.
- Size classification is a decision, not a measurement. Reporting three thresholds and two extreme assumptions mitigates that; it does not remove it.
- Twenty-one cells per market per round means every market-level percentage is directional. A difference of a few cells is not a finding.
- The mechanism rests on two rounds, while the small-share gradient itself reproduces in six of six. Those are not equally well supported and should not be read as if they were.
- The capture tool's cited-array parser was seen contradicting its own screenshots in a separate study on 2026-07-29, and it has not been read line by line. Results that depend on the cited array carry that risk; the fire rate and the eye-checked screenshot rows do not.
- Organic capture stops at the top 10, so a cited site absent from that array may rank at 11 or beyond, or not at all, and this study cannot tell those cases apart.
- One operator, one instrument, one vertical, one 17-day window. Nothing here is a population estimate of anything.
How to cite this paper
APA
Nouman, A. (2026). Query competitiveness and citation source composition in Google's AI Overviews: Evidence from a repeated-measures ecommerce query ladder (Version 1.1) [Preprint]. Zenodo. https://doi.org/10.5281/zenodo.21923520BibTeX
@misc{nouman2026,
  author    = {Nouman, Abdullah},
  title     = {{Query Competitiveness and Citation Source Composition in Google's AI Overviews: Evidence From a Repeated-Measures Ecommerce Query Ladder}},
  year      = {2026},
  month     = aug,
  version   = {1.1},
  doi       = {10.5281/zenodo.21923520},
  url       = {https://doi.org/10.5281/zenodo.21923520}
}Read the full paper
Read the paper on: ZenodoResearchGate
No sign-up, no email wall. Nothing loads until you ask for it, and the same file is deposited at the repository record below.
Data availability
157 raw capture-row files, all 504 capture frames, the domain-authority scores and the frozen analysis and figure code, 643.3 MB, deposited in the same record.
Everything above is deposited with the paper in one record, so every table can be re-derived independently: https://doi.org/10.5281/zenodo.21923520